Failure rates. When it comes to what’s happening behind the server closet door, usually “no news is good news”. As long as there’s a peaceful hum and a little heat coming out of there, we move on, feeling good for another day.
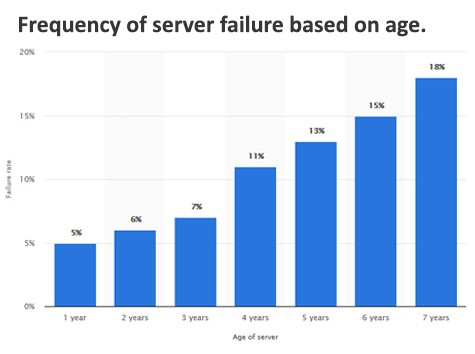
But as the graph below shows, no server lasts forever.

During the first year, servers are shown to have a failure rate of 5%. While this might seem high, it’s often the result of some out-of-the-box defect or initial configuration issue, easily diagnosed and fixed. Over the next two years, rates only rise at a level of 1%, showing a period of stability. Hard drive failures start to spike around year four, pushing our number up to 11%. After that, the curve increases until it becomes clear that a server replacement is not just of question of if, but when.
A similar graph shows Server Downtime by age. Reflecting the failure rates above, this graph shows that downtime is relatively flat for the first few years – downtime that might be attributed to planned re-boots and software updates. After that the curve shows a sharp and steady increase indicating unplanned incidents and additional resources spent on IT personnel to address emergency problems.
In other words, a planned investment in hardware now might save you money (and headaches) down the road.
Even if you’re not running a server, the same sort of failure curve applies to Laptops, Workstations, Tablets, and other digital devices. Think ahead, backup, and have a life-cycle replacement plan in place. If you need a second opinion, give us a call. We’re ready to review your network, make recommendations, and guarantee that you’re ready for business.
(Graphs and more information can be found here.)